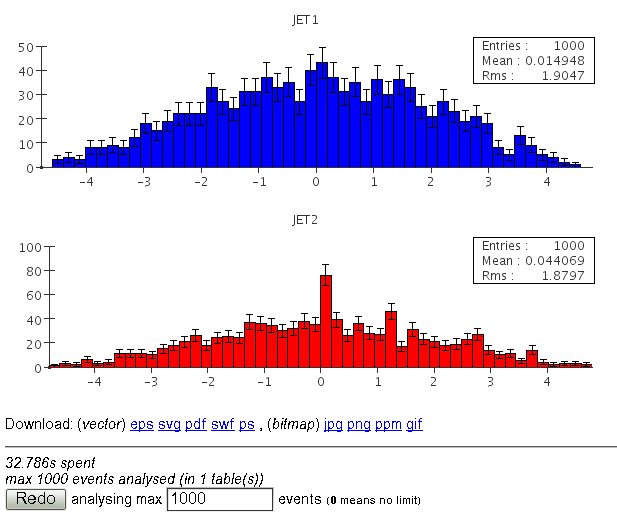
tnsnames.ora file (as a byproduct, a script which translates tnsnames.ora into context.xml usable in JSP services has been written). Currently, the service just show the 1-D histograms, other functionality (2-dim histograms, fits, ...) could be easily added if needed because there is a complete analyses package running behind the service.The accumulated testing examples are available from http://cern.ch/SQLTuple/HistogramTest.html. The service API is:
http://cern.ch/SQLTuple/Histogram.jsp
?database=<database name as declared in tnsnames.ora>
&select=<SQL select clause as "column_name as histogram_name">
&from=<comma separated table names as "schema1.table1,schema2.table2>
&where=<SQL where clause>
&limit=<maximum number of rows to analyse, "0" indicates no limit, the default is "1000">
The time for creation of one histogram from one table is roughly linear with the number of events (which could be controlled by
limit parameter):
t = 3s + 1s * (nevents / 100000) + 1s * (nevents / 25000)
This number should be multiplied if more histograms are requested and more tables are queried.

PHP/JavaScript solutions have been abandoned for two reasons:
- All PHP/JavaScript do very nice drawing. But they don't understand what is a histogram. That means, that we would have to implement all functionality about binning, selecting limits, text legends,...
- There is a serious memory limit on the PHP server so that we could only accumulate histograms up to about 1000 entries there. (There is no limit on the new service).


